
A “clean” power quality report is often the most dangerous document in an industrial facility. You’ve likely experienced the frustration of unexplained equipment downtime even when a third-party audit claims your system meets basic standards. When interpreting power quality analysis reports, complex jargon and dense graphs frequently obscure the very risks they’re meant to highlight, leaving expensive MV/LV switchboards vulnerable to hidden disturbances.
Mastering this technical data is essential for any engineer committed to infrastructure longevity. By understanding the specific data points defined by IEC 61000-2-4:2024 and EN 50160:2022, you’ll diagnose systemic vulnerabilities that others miss. This article provides the technical clarity needed to justify critical budgets for capacitor banks or protection relay retrofits. We’ll outline the methodology for utilizing modern disturbance recording systems to transition from reactive repairs to a proactive, AI-driven maintenance strategy that secures your plant’s operational future.
Key Takeaways
- Understand the critical distinction between general power quality metrics and high-speed disturbance recording to pinpoint the exact source of system failures.
- Master the technical nuances of interpreting power quality analysis reports to identify how Total Harmonic Distortion and voltage sags impact the thermal health of motors and transformers.
- Validate your facility’s compliance with global benchmarks, including IEC 61000-4-30 Class A and the 2022 updates to EN 50160 standards for voltage characteristics.
- Learn to correlate disturbance logs with SCADA event sequences to provide data-driven justification for necessary capacitor bank installations or circuit breaker retrofits.
- Develop a systematic maintenance strategy that prioritizes disturbances based on equipment criticality to ensure the long-term reliability of your LV and MV switchboards.
What is Power Quality and Disturbance Recording?
In the industrial sector, Electric Power Quality represents the degree to which the electrical system supports the reliable and efficient operation of connected equipment. It’s not merely a measure of availability; it’s a complex assessment of voltage stability, frequency regulation, and waveform purity. When engineers begin interpreting power quality analysis reports, they often find that standard metrics only tell half the story. While a facility might technically comply with regional grid codes, internal disturbances can still cause significant operational friction.
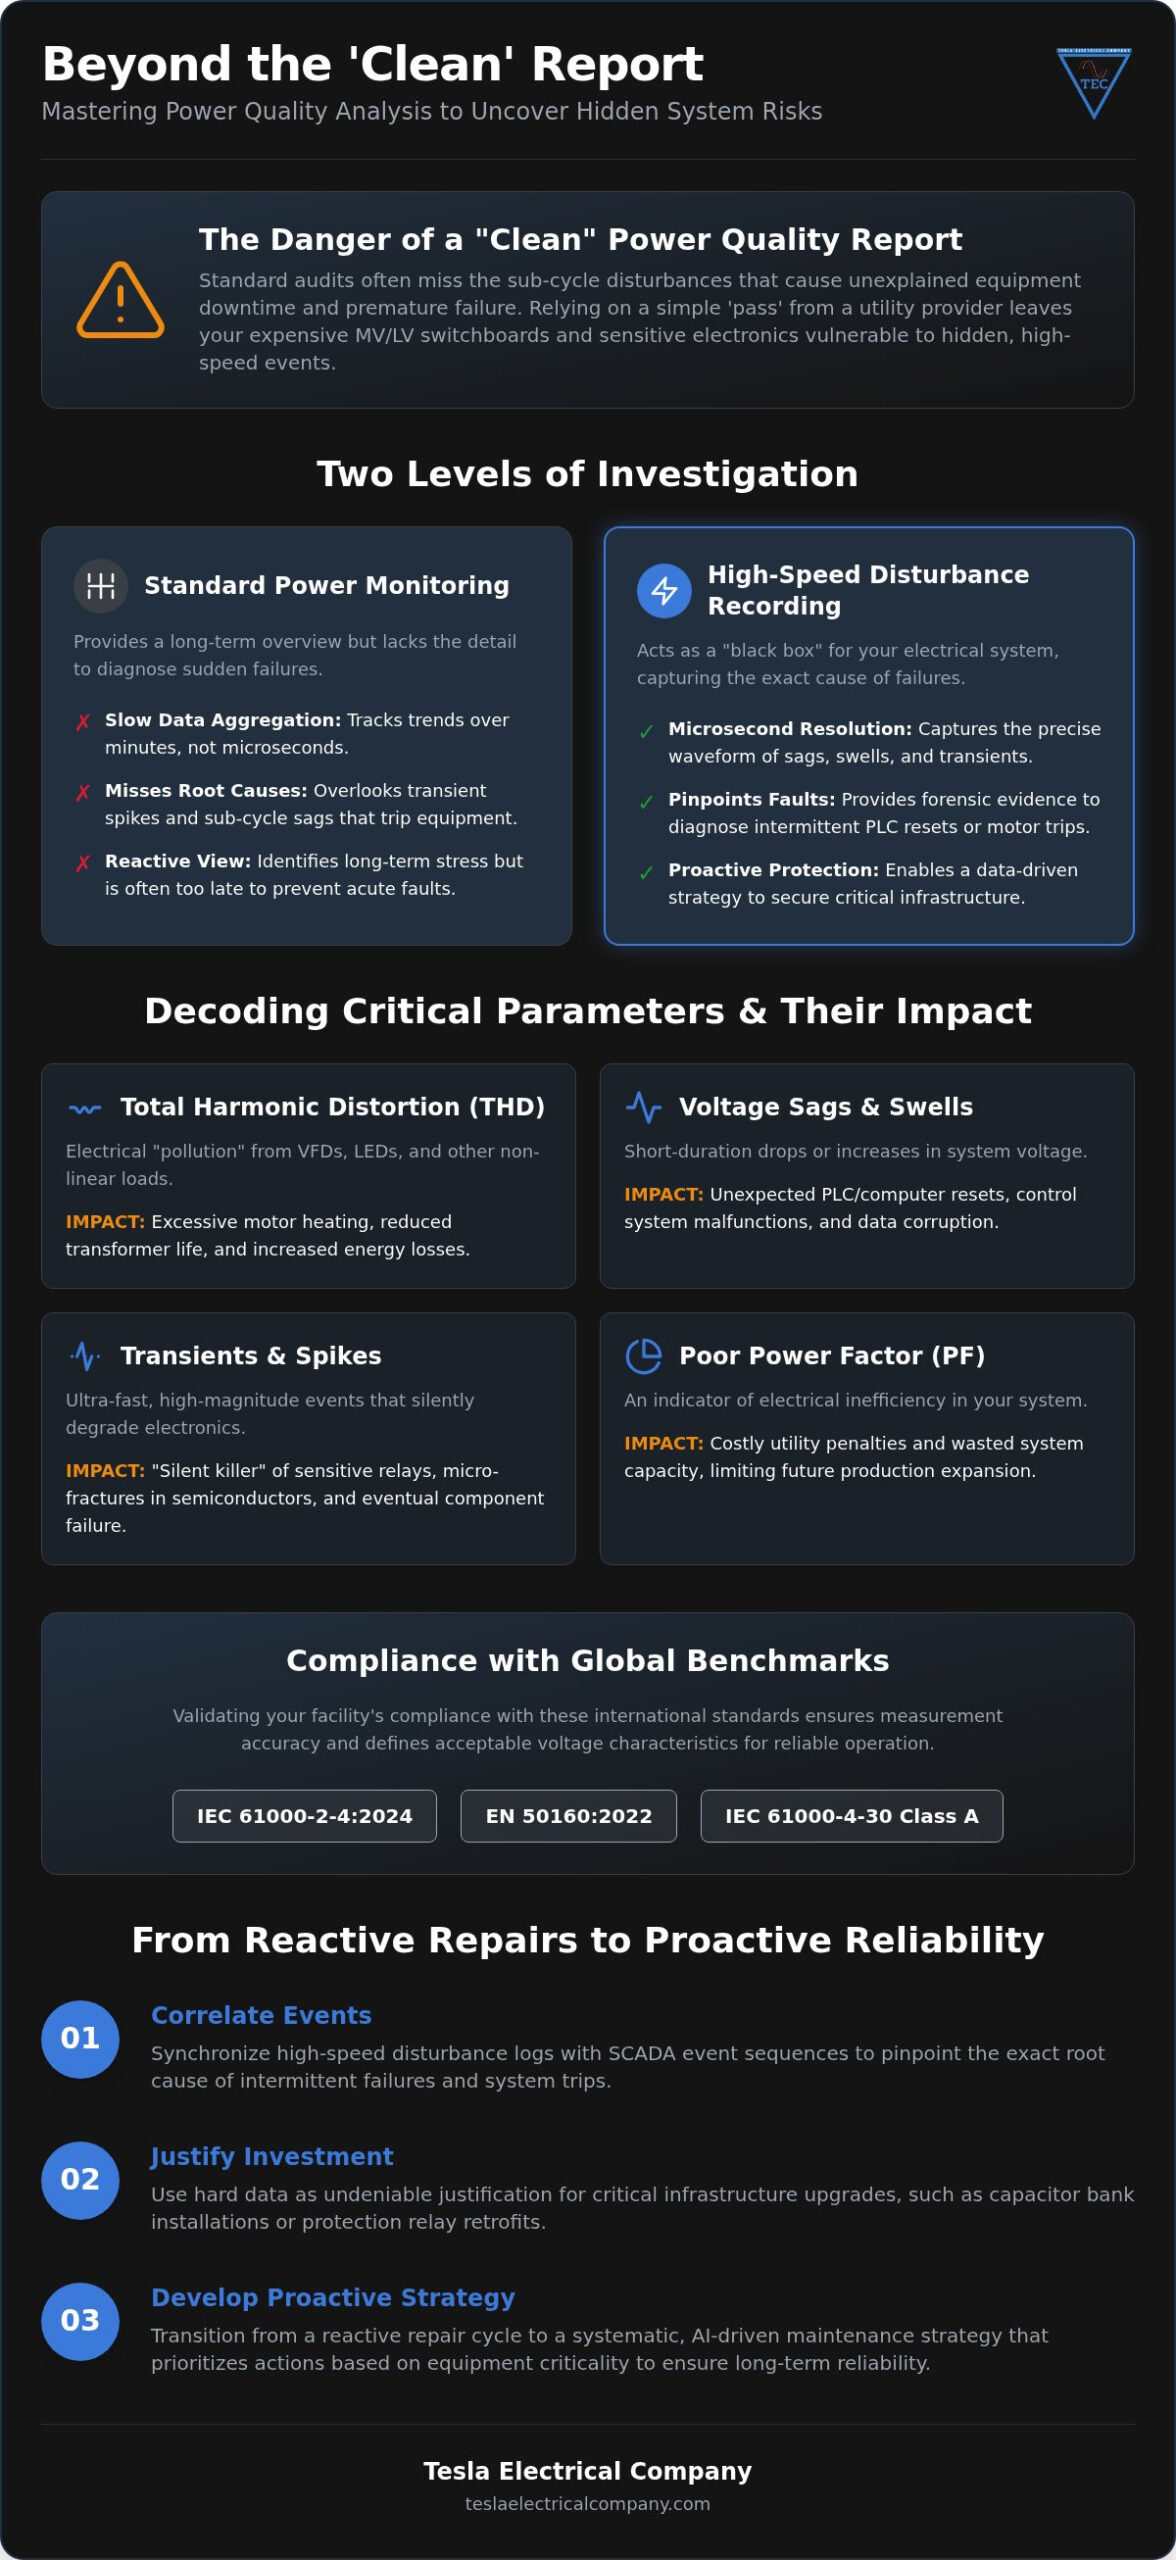
Disturbance recording serves as the high-speed diagnostic layer of this assessment. Unlike standard metering, which aggregates data over minutes, disturbance recording captures anomalous events like sags, swells, and sub-cycle transients at micro-second resolutions. This granularity is vital because modern industrial loads, particularly sensitive electronics and automation controllers, are susceptible to disturbances that standard audits often overlook. Relying on a simple ‘pass’ from a utility provider doesn’t guarantee your plant’s internal infrastructure is safe from premature failure.
The Core Objectives of Power Quality Analysis
A rigorous analysis serves three primary functions. First, it identifies the root cause of intermittent failures, such as unexpected PLC resets or motor overheating. Second, it establishes a data-driven baseline for a switchgear condition assessment, ensuring that modernization efforts target the most vulnerable components. Finally, these reports validate the performance of infrastructure upgrades, including the integration of VFD control panels or capacitor banks, by confirming they’ve successfully mitigated existing issues without introducing new harmonic distortions.
The Difference Between Monitoring and Recording
Effective infrastructure management requires a dual approach. Continuous monitoring tracks long-term trends, such as power factor and harmonic growth, which is essential for interpreting power quality analysis reports focused on energy efficiency and thermal stress. In contrast, event-based recording triggers only when a specific threshold is breached, capturing the exact waveform of a voltage dip or a transient spike.
A comprehensive audit report synthesizes both data sets. While trends indicate the steady-state health of the system, disturbance logs provide the “black box” evidence needed to diagnose sudden system trips. Periodic audits are often too late to catch a developing fault. Permanent systems provide the continuous oversight necessary to protect expensive MV and LV switchboards from the hidden risks of an unstable grid.
Decoding Key Parameters in Your Power Quality Report
Effective interpretation of power quality data requires a granular understanding of how specific electrical phenomena manifest as physical asset damage. When interpreting power quality analysis reports, engineers must look beyond aggregate averages to identify the peak values that cause insulation breakdown. While large-scale infrastructure stability is a priority for federal agencies, as highlighted in the National Transmission Planning Study, the responsibility for protecting sensitive local loads rests with plant management. Identifying these parameters is the first step toward securing your electrical infrastructure.
Total Harmonic Distortion (THD) is a primary indicator of electrical pollution, representing the ratio of the sum of all harmonic components to the fundamental frequency. High THD levels lead to excessive motor heating and significantly reduced transformer life due to increased eddy current losses. Similarly, transients and high-frequency spikes act as silent killers of sensitive electronic relays and SCADA components, often causing micro-fractures in semiconductor layers that lead to eventual failure. Finally, a poor Power Factor (PF) doesn’t just result in utility penalties; it consumes valuable system capacity, limiting your ability to expand production without costly switchboard upgrades.
Harmonics and THD: Identifying Electrical Pollution
Reports typically distinguish between current harmonics (THDi) and voltage harmonics (THDv). Current harmonics are generally facility-generated, driven by non-linear loads like VFDs and LED lighting. This is why sophisticated industrial VFD control panel design must incorporate active or passive filters to suppress these frequencies at the source. When reviewing your report, look for the “spectrum” or “histogram” graphs; a high concentration of 5th and 7th harmonics often points directly to six-pulse rectifier sets within your motor drives.
Voltage Fluctuations: Sags, Swells, and Dips
Voltage sags, or brief reductions in voltage magnitude, are the leading cause of industrial downtime. To visualize equipment tolerance, reports utilize the ITIC (CBEMA) curve, which plots the depth of a sag against its duration. If a disturbance falls outside the “no interruption” zone, your equipment is at risk. Distinguishing between grid-side disturbances and facility-generated sags is critical for liability and technical resolution. For facilities experiencing chronic sags from the utility, implementing a redundant control system architecture ensures that critical processes remain online during transient events. Optimizing your system capacity often starts with the installation of high-performance capacitor banks to correct power factor issues identified in your latest audit. Deploying dedicated voltage dip recording systems is the most reliable method to capture the precise signature of these events and build an empirical case for targeted infrastructure improvements.
Understanding Power Quality Standards (IEC 61000 and EN 50160)
The technical integrity of an electrical audit hinges entirely on the standards governing the measurement hardware and methodology. When interpreting power quality analysis reports, engineers must first verify that the data was captured using instruments compliant with IEC 61000-4-30 Class A. This standard ensures that different meters measuring the same signal will produce identical results, eliminating the measurement uncertainty that often plagues lower-tier audits. Without this level of precision, report findings are frequently inadmissible in contractual disputes with utility providers or equipment manufacturers. While IEEE 1159 remains the essential framework for categorizing disturbances, the technical rigor of Class A measurement is the benchmark for forensic-level analysis.
Adherence to EN 50160:2022 is equally vital, as it defines the voltage characteristics that public distribution grids must maintain under normal operating conditions. Modern industrial facilities utilize EPRI Power Quality Benchmark Results to compare their internal performance against established industry averages and identify where their system deviates from the norm. Relying on certified recording equipment isn’t just a matter of regulatory compliance; it’s a fundamental requirement for ensuring the integrity of the data used to authorize high-capital modernization projects or retrofitting services.
Class A vs. Class S Measurement Accuracy
Class A instruments utilize synchronized timing and specific aggregation windows to eliminate measurement drift. This precision is mandatory for contractual disputes and deep forensic investigations into catastrophic equipment failure. In contrast, Class S instruments are suitable for general energy surveys but lack the high-frequency sampling rates required to capture micro-second transients or precise harmonic phase angles. To verify the validity of your report, ensure the instrument certificate explicitly states compliance with IEC 61000-4-30 Class A Edition 3, which is the current benchmark for high-precision applications.
Local Grid Compliance in the UAE
Industrial consumers within the UAE must adhere to stringent grid connection standards to maintain national infrastructure stability as we move toward 2026. Reports generated by permanent monitoring systems allow facilities to demonstrate ‘grid-friendly’ operation by proving that facility-generated harmonics and flicker remain within permissible limits. Achieving this level of compliance requires a holistic approach to industrial switchboard design, where protection coordination and harmonic mitigation are integrated from the initial engineering phase. This systematic oversight prevents utility penalties and ensures the long-term reliability of your MV and LV infrastructure.
From Report to Action: Developing a Maintenance Strategy
Data without a structured response is merely noise. Once the technical benchmarks are established, the focus must shift toward a methodical maintenance strategy that translates findings into systemic improvements. When interpreting power quality analysis reports, engineers should follow a four-step prioritization framework to ensure resources are allocated where they most impact system reliability.
- Step 1: Prioritize disturbances based on equipment criticality and failure frequency. Focus on events that coincide with the downtime of high-value assets, such as production line PLCs or medium-voltage motors.
- Step 2: Correlate disturbance logs with SCADA event sequences. This cross-referencing confirms cause-and-effect, distinguishing between external grid transients and internal switching surges.
- Step 3: Evaluate protection health. Analyze whether existing protection relays and circuit breakers are operating within their intended curves or if they’ve been compromised by repeated exposure to transients.
- Step 4: Design mitigation strategies. Implement targeted hardware solutions, such as high-performance capacitor banks for power factor correction or active filters to neutralize specific harmonic orders.
This systematic approach ensures that every infrastructure investment is backed by forensic-level data. If your current report indicates systemic vulnerabilities, consult with our engineers to design a comprehensive monitoring solution.
Linking Data to Circuit Breaker Retrofits
Frequent transients and overcurrent events recorded in your analysis often signal that existing protection equipment is reaching its operational limit. Modernizing protection relays allows for faster, more precise tripping characteristics that better handle the complex disturbances identified in current audits. A strategic retrofit serves as a cost-effective alternative to full switchgear replacement while significantly extending the life of your electrical distribution assets. By updating only the critical components, you achieve modern performance standards without the capital intensity of a total system overhaul.
Optimizing with Capacitor Banks
Report data provides the precise reactive power requirements needed to size capacitor banks for effective power factor correction. However, installation must be preceded by a thorough review of harmonic levels to avoid the risk of harmonic resonance, which can lead to capacitor failure or system-wide instability. Monitoring the “before and after” impact is essential to validate that the installation has successfully improved system efficiency and eliminated utility penalties. This data-driven validation confirms that the new units are operating within safe thermal limits while maximizing available system capacity.
Tesla Electrical Company: Power Quality and Disturbance Solutions
Tesla Electrical Company provides an authoritative perspective on electrical infrastructure management. We understand that the process of interpreting power quality analysis reports serves as a critical diagnostic roadmap for asset life extension. Our engineering team designs and supplies sophisticated Power Quality and Disturbance Recording Systems that offer a level of technical depth beyond standard compliance audits. By integrating these monitoring capabilities into SCADA and automation system solutions, we provide a unified platform for tracking system health and diagnosing complex electrical events.
Our commitment to industrial reliability across the UAE is reflected in our end-to-end service delivery. We don’t just provide data; we provide the engineering solutions required to resolve the issues that the data reveals. Whether your facility requires a minor protection relay adjustment or a major switchboard modernization, our team possesses the technical rigor to manage the project from design through to final execution. This holistic approach ensures that your infrastructure remains a grounded and dependable partner in your production process.
Custom Power Quality Monitoring Systems
We specialize in the design of permanent power quality recording panels for both LV and MV switchboards. These systems are equipped with high-speed disturbance recorders that capture transients and voltage sags at high sampling rates, ensuring that no event goes unrecorded. Each system features automated reporting and remote data access, allowing for immediate notification when parameters deviate from set limits. This systematic approach to monitoring provides the baseline data necessary for interpreting power quality analysis reports with the accuracy required for high-stakes decision-making and long-term planning.
Comprehensive Industrial Retrofit Services
Our team provides specialized expertise in retrofitting aging circuit breakers and protection relays based on the specific findings of power quality audits. We supply the specialized spare parts and engineering skill needed to restore legacy systems to peak performance, ensuring they can withstand the rigors of modern industrial loads. Beyond hardware supply, we provide comprehensive consultancy on upgrading older infrastructure to meet the 2026 UAE grid compliance standards. This human-centric focus on system longevity ensures that your electrical distribution network remains a dependable asset for years to come, minimizing the risk of premature failure in expensive switchgear.
Securing the Future of Industrial Electrical Infrastructure
Transitioning from reactive maintenance to proactive asset management requires a high degree of technical rigor. By prioritizing data captured via Class A instrumentation and correlating disturbance logs with SCADA events, engineers can eliminate the ambiguity often found in standard audits. Mastering the nuances of interpreting power quality analysis reports is the definitive step toward identifying latent risks before they manifest as catastrophic equipment failure. This methodical approach ensures that every infrastructure investment is backed by forensic-level evidence rather than guesswork.
As specialists in LV and MV switchboard design and advanced disturbance recording system integration, Tesla Electrical Company provides the national UAE industrial engineering expertise required to modernize legacy systems. We ensure your infrastructure remains compliant with evolving grid standards while maximizing operational uptime through targeted retrofitting and power factor correction. Request a Technical Consultation for Your Power Quality and Disturbance Recording Needs to begin your journey toward a more stable and efficient operational future. Your system’s long-term reliability is achievable with the right data and a committed partner.
Frequently Asked Questions
What is the difference between a power quality audit and continuous disturbance recording?
A power quality audit is a periodic, time-bound measurement that provides a snapshot of system health. In contrast, a continuous disturbance recording system remains permanently installed to capture high-speed transients and sags in real-time. While audits are useful for basic compliance, permanent recording is essential for identifying intermittent faults that occur outside of a scheduled testing window. This ensures that no sub-cycle event goes undetected in critical industrial infrastructure.
How often should an industrial facility perform a power quality analysis?
Facilities without permanent monitoring should conduct a comprehensive analysis at least once a year or following any significant infrastructure modification. If you’ve recently installed new VFD control panels or expanded production lines, a new report is vital to ensure harmonic levels remain within limits. For facilities in the UAE, regular analysis helps maintain compliance with national grid standards while providing the data necessary for interpreting power quality analysis reports effectively over time.
Can poor power quality cause my circuit breakers to trip without a visible fault?
Poor power quality is a frequent cause of nuisance tripping in circuit breakers even when no physical short circuit is present. High levels of Total Harmonic Distortion (THD) can cause protection relays to misinterpret the waveform, leading to unexpected outages. Similarly, transients can trigger sensitive overcurrent settings. If your breakers trip without a clear cause, a voltage dip recording system can identify the specific electrical signature responsible for the interruption.
What are the most common indicators that I need a power quality report?
Common indicators include the unexplained resetting of PLC control systems, excessive heat in transformers, or the premature failure of capacitor banks. You might also notice flickering lights or audible noise from motors. These symptoms suggest that the degree of electrical pollution has exceeded equipment tolerances. Obtaining a report allows you to pinpoint the root cause, whether it’s facility-generated harmonics or external grid instability, before catastrophic failure occurs.
Is it better to retrofit old switchgear or replace it entirely after a poor PQ report?
Retrofitting is often the most strategic choice for aging infrastructure, as it allows for the modernization of critical components like protection relays and circuit breakers without the capital expense of full switchgear replacement. Interpreting power quality analysis reports helps determine which specific parts have been compromised by electrical stress. By focusing on high-performance retrofits, you can restore system reliability and extend asset life while meeting current 2026 technical standards.
How do harmonics affect the lifespan of my industrial motors?
Harmonics significantly reduce motor lifespan by inducing excessive thermal stress and increasing eddy current losses within the stator and rotor. These non-linear frequencies don’t contribute to torque but do generate heat that degrades insulation over time. Studies by organizations like the International Electrotechnical Commission indicate that even moderate harmonic distortion can lead to a 50% reduction in insulation life. This makes harmonic mitigation a priority for any facility managing large motor loads.
What does ‘Class A’ mean in the context of power quality measurement?
‘Class A’ refers to the highest accuracy tier defined by the IEC 61000-4-30 standard for power quality measurement. Instruments certified to Class A utilize synchronized timing and standardized aggregation windows to ensure that measurements are consistent across different devices. This level of precision is mandatory for any report intended for use in legal disputes or contractual negotiations with utilities. It guarantees that the data is technically sound and universally comparable.
Can a SCADA system help in interpreting power quality data?
Integrating power quality data into a SCADA system provides the context needed to understand why specific disturbances occur. By correlating electrical events with operational logs, you can see if a voltage sag was caused by a large motor start or an external grid event. This synchronization transforms raw data into actionable intelligence. It allows engineering teams to identify cause-and-effect relationships that would be invisible in a standalone power quality report.
Disclaimer
Some content, images, text, or other materials on this website may have been created or assisted by artificial intelligence (AI).
While we review AI-generated content for accuracy and quality, we do not guarantee that all information is free from errors or omissions.
Content generated using AI is provided for informational purposes only and should not be solely relied upon without independent verification.
3 Responses